2. Functions
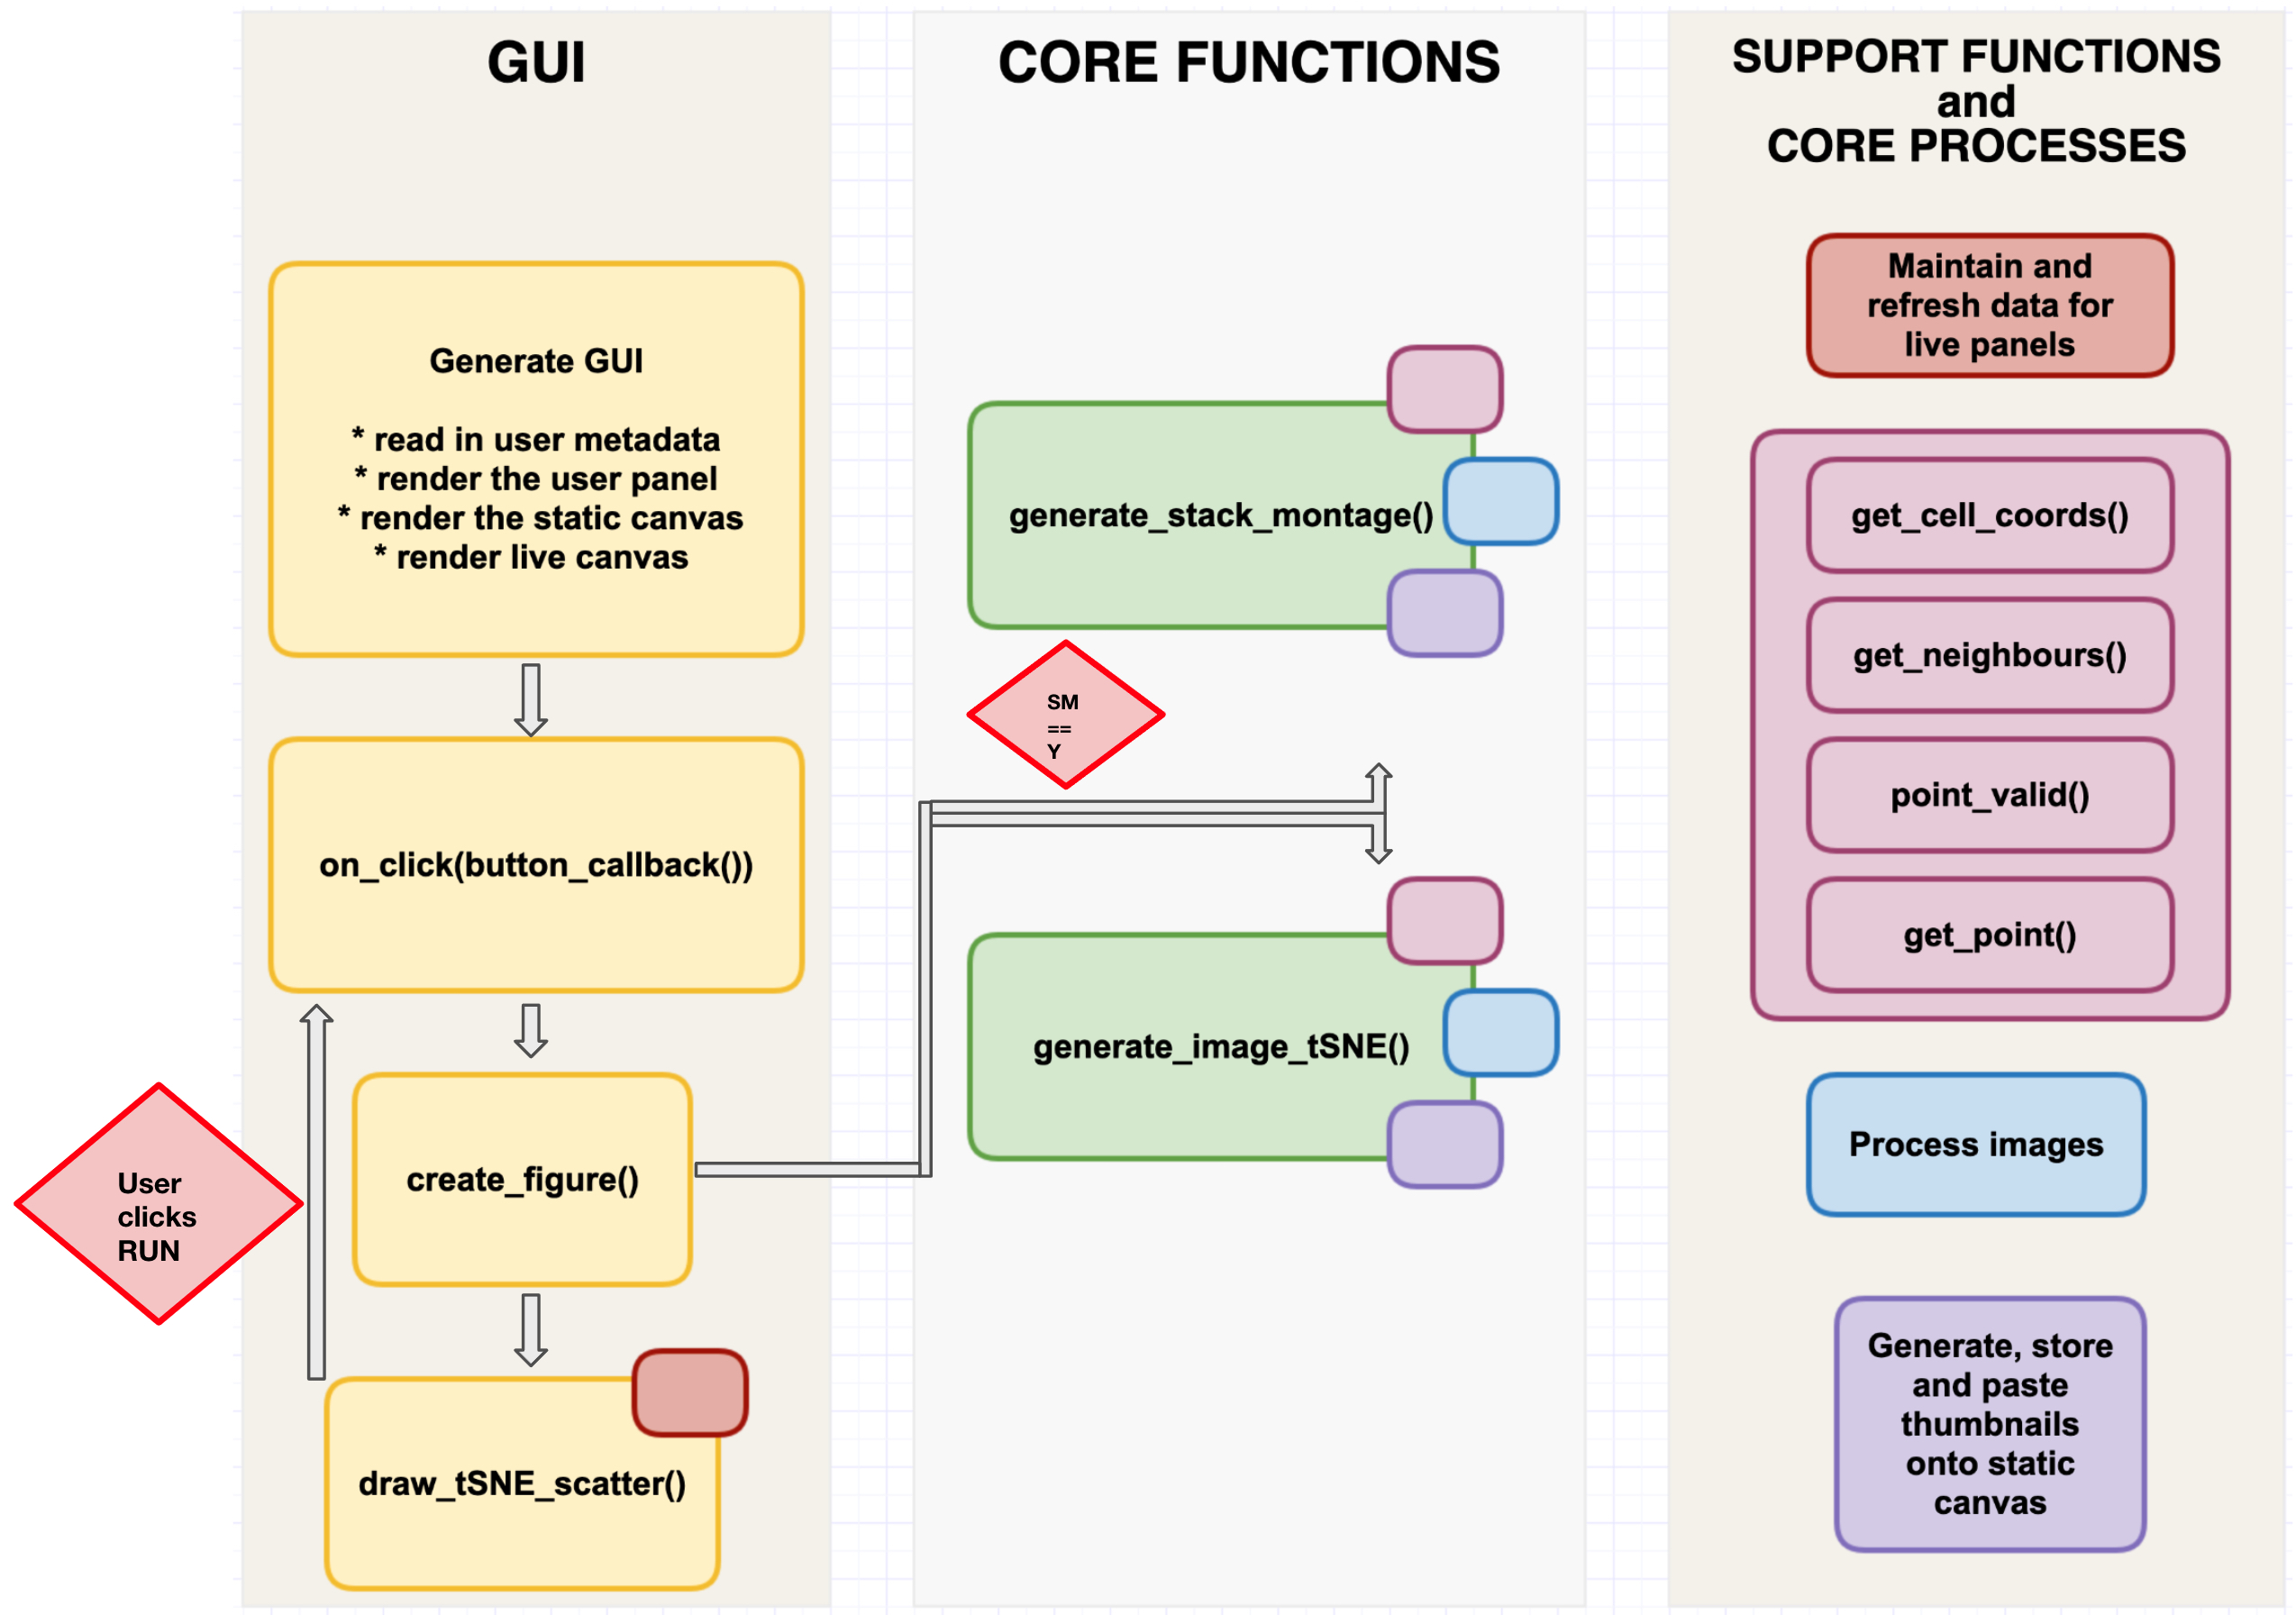
Flowchart sketching flow between functions and processes in Mistic. (SM = Stack montage, Y = Yes, N = No)
2.1. get_cell_coords(pt,a)
Get the coordinates of the cell that pt = (x,y) falls in.
def get_cell_coords(pt,a):
        return int(pt[0] // a), int(pt[1] // a)
Parameters:
pt : float2D coordinates of a point
a : floatscaled minimum distance between cellsOutput
listcoordinates of the cell that pt lies in
2.2. get_neighbours(coords,nx,ny,cells)
Return the indexes of points in cells neighbouring cell at coords. For the cell at coords = (x,y), return the indexes of points in the cells with neighbouring coordinates illustrated below: ie those cells that could contain points closer than r
def get_neighbours(coords,nx,ny,cells):
    # Refer main.py on Github
     return neighbours
Parameters:
coords : float2D coordinates of a point
nx, ny : intNumber of cells in the x- and y-directions of the grid
cells : dictionaryDictionary of cells or grid squares: each key is a cell’s coordinates, the corresponding value is the index of that cell’s coordinates in the samples list (or None if the cell is empty)
Output
neighbours: listList of neighbouring cells for coords
2.3. point_valid(pt,a,nx,ny,cells,samples,r)
Returns True or False based on if the pt is a valid point to be added to samples. It must be no closer than r from any other point by checking the cells in its immediate neighbourhood.
def point_valid(pt,a,nx,ny,cells,samples,r):
    # Refer main.py on Github
     return True (or False)
Parameters:
pt : float2D coordinates of a point
a : floatscaled minimum distance between cells
nx, ny : intNumber of cells in the x- and y-directions of the grid
cells : dictionaryDictionary of cells or grid squares: each key is a cell’s coordinates, the corresponding value is the index of that cell’s coordinates in the samples list (or None if the cell is empty)
samples : listList with valid neighbouring coordinates for a given point pt
r : intMinimum distance between samples. Set to 2Output
booleanReturns True or False if sampled point is eligible to be pt’s neighbour
2.4. get_point(k, refpt,r,a,nx,ny,cells,samples)
Try to find a candidate point relative to refpt to emit in the sample. We draw up to k points from the annulus of inner radius r, outer radius 2r around the reference point, refpt. If none of them are suitable (because they’re too close to existing points in the sample), return False. Otherwise, return the pt.
def get_point(k, refpt,r,a,nx,ny,cells,samples):
     # Refer main.py on Github
     return True (or False)
Parameters:
k : intnumber of candidate points sampled arounf the reference point, refpt
refpt : float2D coordinates of the reference point
a : floatscaled minimum distance between cells
nx, ny : intNumber of cells in the x- and y-directions of the grid
cells : dictionaryDictionary of cells or grid squares: each key is a cell’s coordinates, the corresponding value is the index of that cell’s coordinates in the samples list (or None if the cell is empty)
samples : listList with valid neighbouring coordinates for a given point pt
r : intMinimum distance between samples. Set to 2Output
booleanReturns True or False if candidate point is eligible to be refpt’s neighbour
Note
The above functions: get_cell_coords(), get_neighbours(), point_valid(), get_point() are modified from
https://scipython.com/blog/poisson-disc-sampling-in-python/
2.6. create_figure(stack_montage_flag)
Function collects the user choices from the GUI and calls either the generate_stack_montage() for reading in a single image or the generate_image_tSNE() for multiplexed images
def create_figure(stack_montage_flag):
     # Refer main.py on Github
     return ([p,tsne_points, file_name_hover,markers_single, cluster_ms_list])
Parameters:
stack_montage_flag : boolIf True, the generate_stack_montage() is called, else the generate_image_tsne() is called.Output
p : figureStatic figure canvas with the image tSNE
tsne_points : float2D coordinates for each image where coordinates can be randomly generated/arranged in rows/user defined. The coordinates are generated based on number of images and size (length and breadth) of the static canvas
file_name_hover : strfile name with path to populate the ‘thumbnail’ entry in the Hover tool
markers_single : listlist of markers selected by the user
cluster_ms_list : listlist of channel names necessary to populate the hover tool in the live panels
2.7. generate_stack_montage(chk_box_marker_sm, rb_imtech_val, LABELS_MARKERS)
Function generates a stack montage by using each marker channel of a multiplexed image.
Reads in and pre-processes the image channels
Generates evenly-spaced points on the static canvas to arrange the images in rows
Generates thumbnails, and pastes these onto the static canvas
Stores the thumbnails in the output folder
Updates the hover tool with thumbnail paths, marker names and metadata
def generate_stack_montage(chk_box_marker_sm, rb_imtech_val, LABELS_MARKERS):
     # Refer main.py on Github
     return([file_name_rot,tsne, file_name_hover])
Parameters:
chk_box_marker_sm : intIf checkbox is checked by user on the GUI, chk_box_marker_sm = 1 indicating that the stack montage option is selected. If checkbox is unchecked, the multiple image tSNE generation process proceeds based on markers chosen by the user using the GUI
LABELS_MARKERS : listList of all marker channels in the multiplexed images. This is provided by the user in user_inputs/metadata folder as Markers.csv. User can still choose a subset of LABELS_MARKERS, through the GUI, for visualizing the image tSNE
rb_imtech_val : intIf value = 0, Vectra processing is invoked, if value = 1, t-CyCIF processing is invoked and if value = 2, CODEX processing is invokedOutput
file_name_rot : strfile name with path where the final image with thumbnails is located
tsne : float2D coordinates for each image to be rendered in rows. The coordinates are generated based on number of images and size (length and breadth) of the static canvas
file_name_hover : strfile name with path to populate the ‘thumbnail’ entry in the Hover tool
2.8. generate_image_tSNE(chk_box_marker,rb_val,rb_rs_val, rb_shf_val,rb_imtech_val,mc,wc,LABELS_MARKERS)
Function generates the image tSNE using the multiplexed images and based on user inputs
Reads in and pre-processes the images
Generates random or evenly-spaced points on the static canvas to arrange the images in rows/Reads in the user-provided tSNE
Generates thumbnails, and pastes these onto the static canvas
Stores the thumbnails in the output folder
Updates the hover tool with thumbnail paths, marker names and metadata
shuffle or no shuffle option is handled in this function where images are randomly shuffled
def generate_image_tSNE(chk_box_marker,rb_val,rb_rs_val,rb_shf_val,rb_imtech_val,mc,wc LABELS_MARKERS):
     # Refer main.py() on Github
     return([file_name_rot,tsne, file_name_hover])
Parameters:
chk_box_marker : intIf checkbox is checked by user on the GUI, chk_box_marker = 1 and the user-selected markers are collected by this variable
rb_val : strChoice of having a border for each image based on image metadata. If ‘No’ is chosen, no border is set for images
rb_rs_val : strChoice to create a tSNE based on user-defined points, random coordinates or stack the images in rows
rb_shf_val : strChoice to shuffle images (‘Yes’) or not (‘No’) while rendering the images on the static canvas
rb_imtech_val : intIf value = 0, Vectra processing is invoked, if value = 1, t-CyCIF processing is invoked and if value = 2, CODEX processing is invoked
mc : listList of all markers available as shown on GUI
wc : listList of weights for all markers shown on GUI
LABELS_MARKERS : listList of all marker channels in the multiplexed images. This is provided by the user in user_inputs/metadata folder as Markers.csv. User can still choose a subset of LABELS_MARKERS, through the GUI, for visualizing the image tSNEOutput
file_name_rot : strfile name with path where the final image with thumbnails is located
tsne : float2D coordinates for each image where coordinates can be random/arrnaged in rows/user defined. The coordinates are generated based on number of images and size (length and breadth) of the static canvas
file_name_hover : strfile name with path to populate the ‘thumbnail’ entry in the Hover tool
2.9. draw_tSNE_scatter(tsne1,file_name_hover,cluster_ms_list)
Function that generates the image tSNE scatter plots for the Live canvases
Parameters
tsne1 : float2D coordinates for each image where coordinates can be randomly generated/arranged in rows/user defined. The coordinates are generated based on number of images and size (length and breadth) of the static canvas
file_name_hover : strfile name with path to populate the ‘thumbnail’ entry in the Hover tool
cluster_ms_list : listlist of channel names necessary to populate the hover tool in the live panelsOutput
p1, p2, p3, p4 : figureLive canvas with tSNE scatter plots for each of the image metadata
source : ColumnDataSource, dictionaryDictionary of metadata and associated variables (like colour, thumbnail location) for each image which is maintained and updated based on user preferences for each ‘Run’ episode