7. Vignettes on Vectra data
We provide a toy dataset to run Mistic on the NSCLC Vectra FoVs. Check out our Mistic experiments page for examples Mistic has been tested on and Functions for a full list of functions Mistic uses.
7.1. PerkinElmer Vectra based NSCLC FoVs
Each Vectra image is in TIFF format, is up to 43MB in size with dimensions 1344 x 1008, and has 7 marker channels.
Download Mistic as described here Code Installation
Navigate to
Mistic_code/code/user_inputs/
Download data from link.
Place it in the /user_inputs/figures/ folder
Navigate to the /user_inputs/metadata folder
Upload the imaging markers of interest as Markers_ids.csv
A sample .csv is provided in the /metadata/Vectra folder
If using the sample .csv, move this file from /metadata/Vectra to /metadata folder
Upload the markers.csv which is the entire set of markers for that dataset
A sample .csv is provided in the /metadata/Vectra folder
If using the sample .csv, move this file from /metadata/Vectra to /metadata folder
Optional uploads:
Image tSNE co-ordinates as X_imagetSNE.csv
If no user-generated tSNE co-ordinates are provided, Mistic will generate a set of random coordinates to render the images
Cluster labels as Cluster_categories.csv
If cluster labels are not provided, Mistic will cluster the images using a Bayesian mixture model.
Patient_ids as Patient_ids.csv
Treatments as Treatment_catgories.csv
Patient response as Response_categories.csv
If any of these are unavailable, Mistic will use either the randomly-generated or user-provided tSNE points without any color coding i.e. dots are colored in gray, for the live panels.
Sample metadata files are provided for reference in the /metadata/Vectra folder
If using the sample metadata, move the files from /metadata/Vectra into the /metadata folder
Open a command prompt (or the Terminal application), change to the directory containing /code and type
bash mistic.shThis runs a bokeh server locally and will automatically open the interactive dashboard in your browser at http://localhost:5098/image_tSNE_GUI
From the GUI, choose ‘Vectra’ from the dropdown menu, check the boxes for markers of interest and select other options based on image metadata (for example, border, image layout) and click ‘Run’
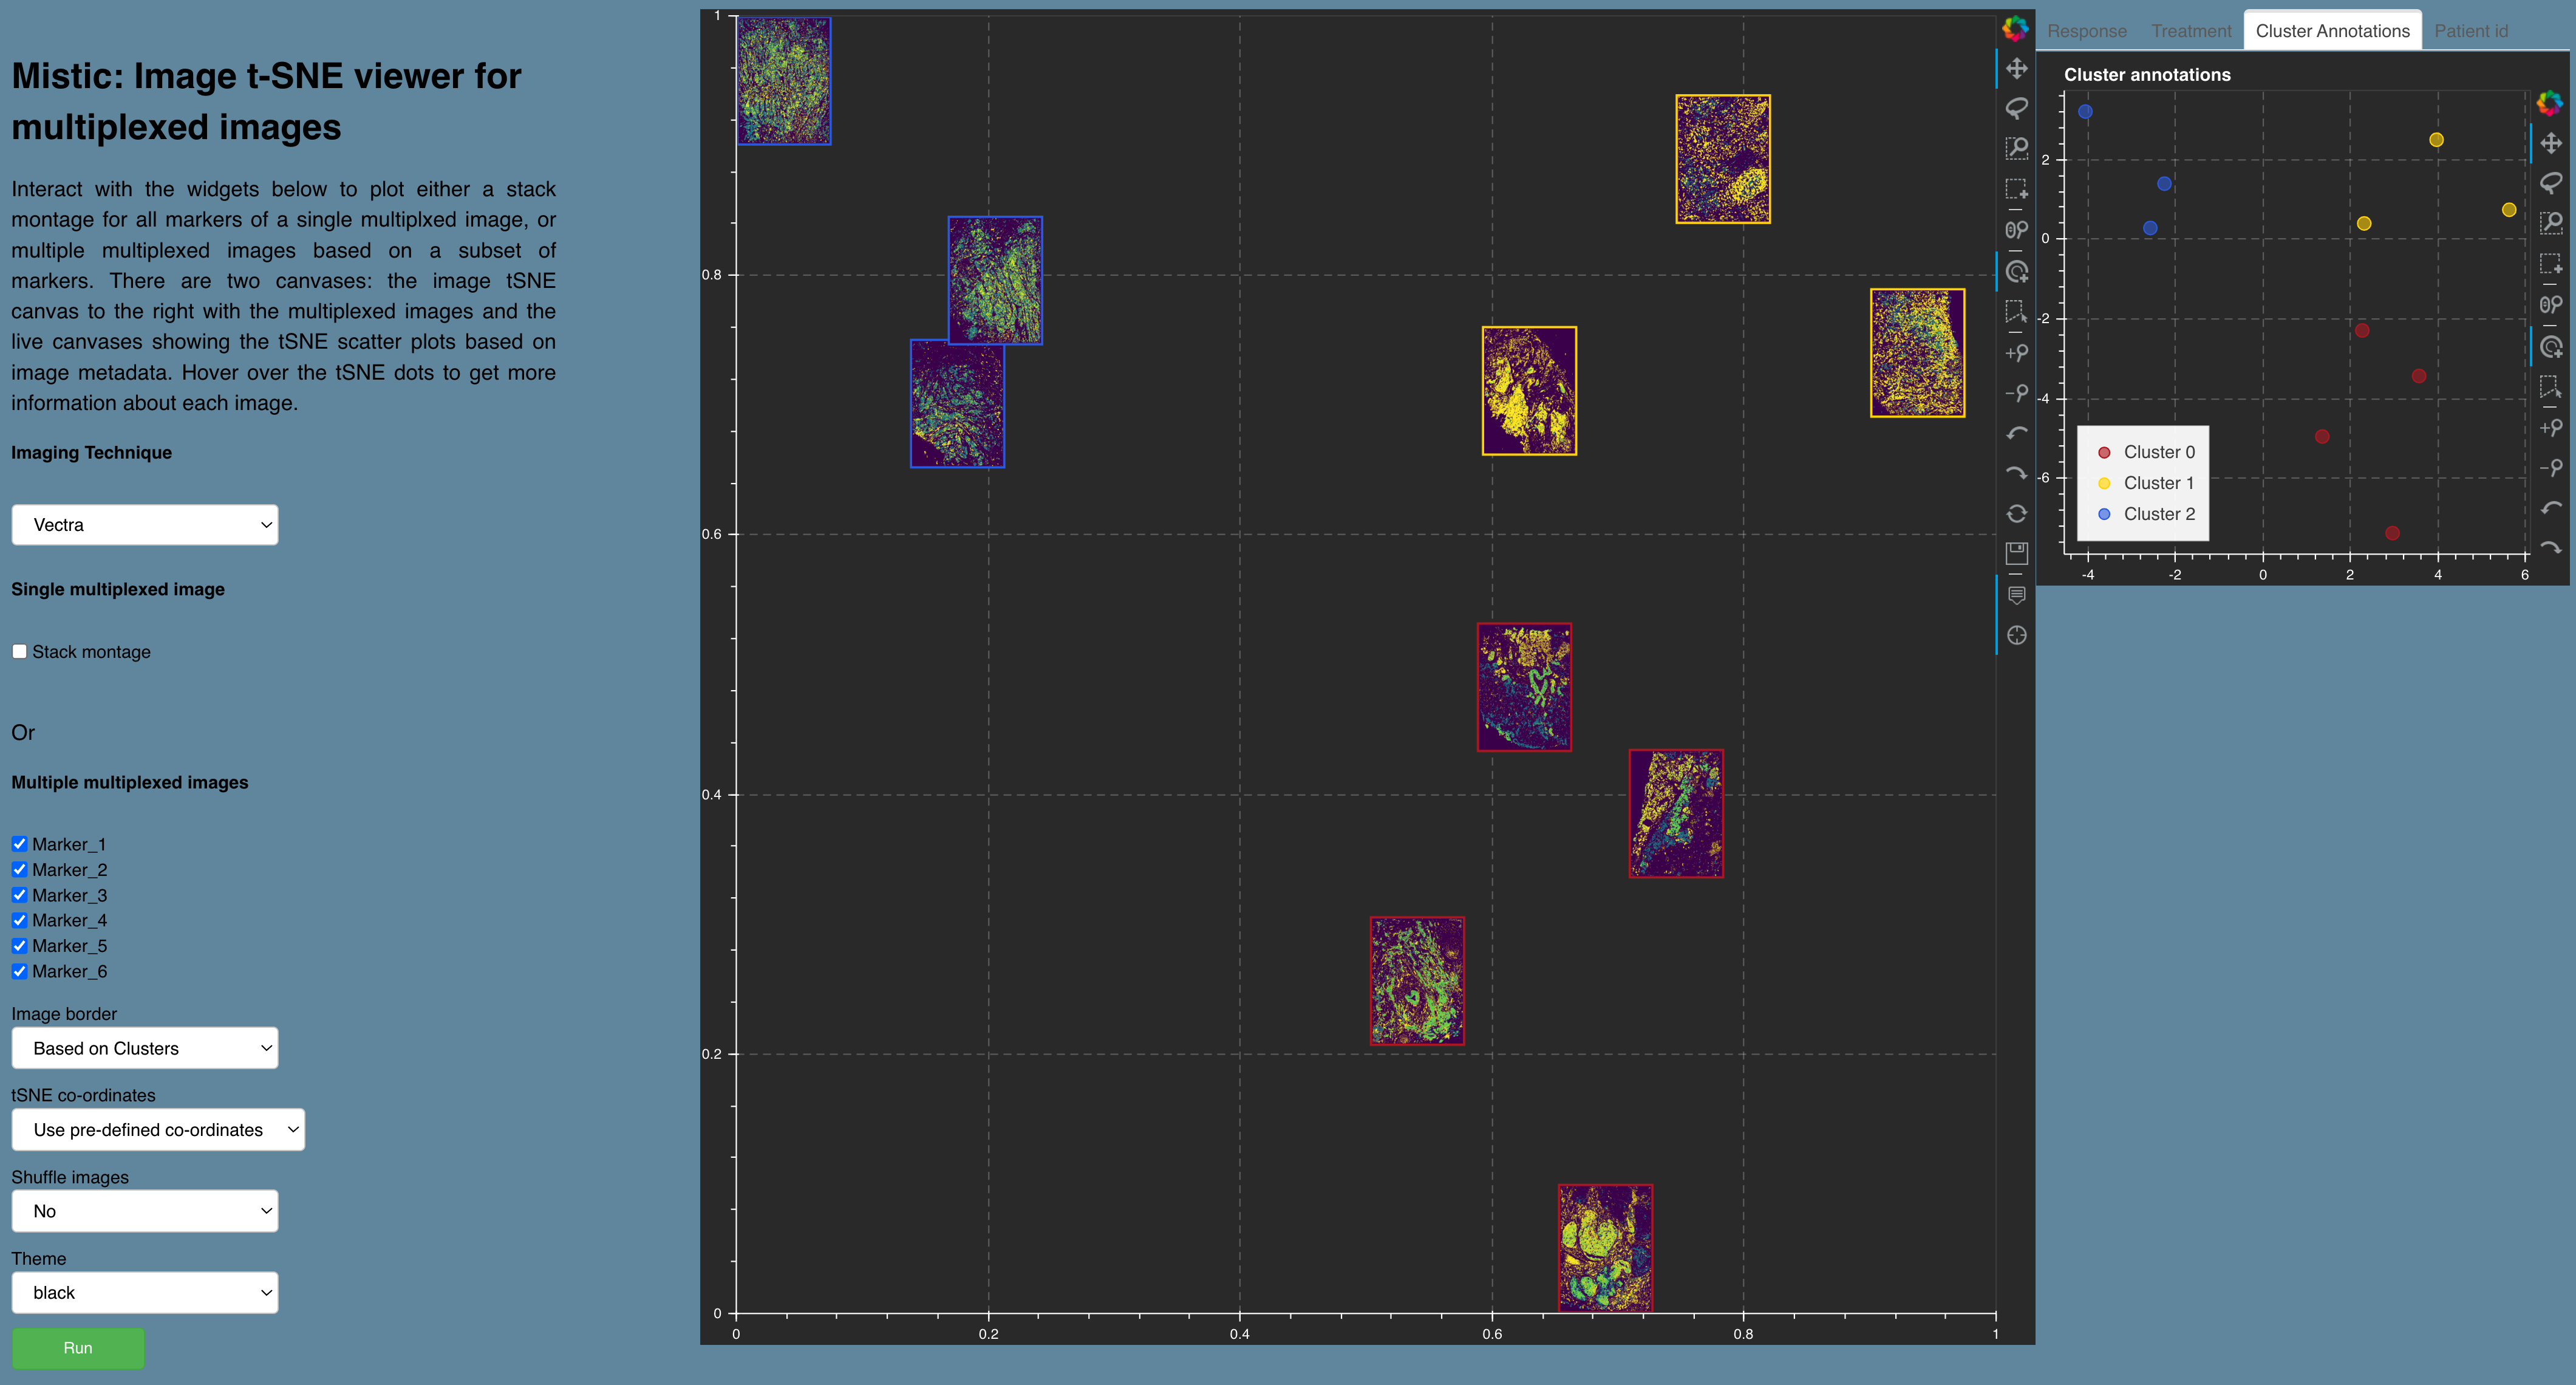
Figure showing Mistic’s output on toy data based on user inputs. The static canvas renders the image t-SNE and the live canvas shows the t-SNE scatter plot for cluster annotations. Each image border is colored based on cluster identity.